
What this chart shows
This chart shows the Sahm Rule Recession Indicator (Sahm Rule) from 1960 to July 2024. The shaded areas represent periods of US economic recessions, as identified by the National Bureau of Economic Research. The Sahm Rule states that when the three-month moving average for unemployment in the US is 50 basis points higher than the minimum of the three-month moving average of the preceding 12 months, a recession is triggered. The indicator was developed by Claudia Sahm, an American Economist, who introduced the measure during her time working at the US Federal Reserve as a policy proposal to address recessions. The Sahm Rule has correctly predicted every recession since 1960. July’s recent US unemployment figures rose to 4.3%, moving the three-month average 0.53% higher than the 12-month minimum, triggering the Sahm Rule.
Why this is important
In recent months, equity markets have been especially attuned to the Fed’s policy decisions, with interest rates in America currently at a 16-year high in response to rampant inflation both domestically and globally. After remaining stubbornly resilient for the past couple years, the economy is now showing signs of cooling down, particularly in the labour market. This slowdown has buoyed expectations that interest rates will be cut sooner rather than later, initially boosting stocks as lower interest rates alleviate pressure on consumers and company debt burdens. However, the latest unemployment figures and triggering of the Sahm Rule have stoked fears that the slowdown has gone too far, contributing to the recent rout in global equities and spike in volatility. Although historically accurate, the Sahm Rule is vulnerable to be disproven. Even its founder notes that US household income is still growing, and consumer spending and business investment remain resilient. Indicators remain such – only indicators – and it is important not to get carried away with both market exuberance and gloom. Being exposed to a portfolio that can be resilient in multiple scenarios provides a robust way to navigate the current macro environment.

Chat of the Week - 1 August
This chart shows the performance of the S&P Oil & Gas Exploration and Production Select Industry Index and the iShares Global Clean Energy ETF during the Trump and Biden administrations.

Chat of the Week - 25 July
This chart shows the top 20 three-month periods of relative outperformance of the S&P 500 market capitalisation weighted index compared to the S&P 500 equally weighted index, along with the subsequent 1-year and 3-year relative returns.

Chat of the Week - 18 July
This chart shows the Citigroup US Economic Surprise Index from the start of 2023.

Chat of the Week - 11 July
This chart shows the spread year-to-date between French and German 10-year government bonds, highlighting the key dates during the French parliamentary election.

Chat of the Week - 4 July
The chart shows the number of times the S&P 500 index has reached an all-time high each calendar year since 1957.

Chat of the Week - 27 June
This chart shows the market capitalisation of the current three largest companies in the world – Apple Microsoft and Nvidia – over the past few years; highlighting Nvidia’s meteoric rise to become the world’s most valuable company

Chat of the Week - 20 June
This chart shows the market capitalisation of the current three largest companies in the world – Apple Microsoft and Nvidia – over the past few years; highlighting Nvidia’s meteoric rise to become the world’s most valuable company

Chat of the Week - 13 June
This chart shows the interest rates in the EU, UK and US over the past four years.

Chart of the Week - 6 June
The chart shows the total assets held in money market funds from 2007 to end May 2024, highlighting a substantial expansion over the period.

Chart of the Week - 30 May
This chart shows the percentage of total US credit card loans outstanding for 90 days or more in arrears, otherwise known as, serious delinquency.

Chat of the Week - 23 May
This chart shows the Congressional Budget Office’s (CBO) projections for total outstanding US debt and interest expenses as a percentage of GDP over the next 30 years.

Chat of the Week - 16 May
This chart shows the Congressional Budget Office’s (CBO) projections for total outstanding US debt and interest expenses as a percentage of GDP over the next 30 years.

Chat of the week - 9 May
This week’s chart looks at how the Federal Reserve’s conclusion of a hiking cycle impacts US Treasuries.

Chat of the Week - 2 May
This chart shows the valuation of the MSCI UK index relative to the MSCI US index using the 12-month forward price-to-earnings ratio.
Chat of the Week - 25 April
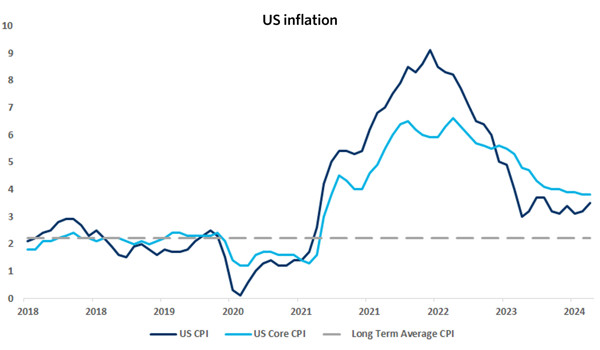
This chart shows the US Headline and Core1 CPI (Consumer Price Index) measure over the past five years, highlighting how disinflationary progress has stalled in recent months.
Chat of the Week - 11 April
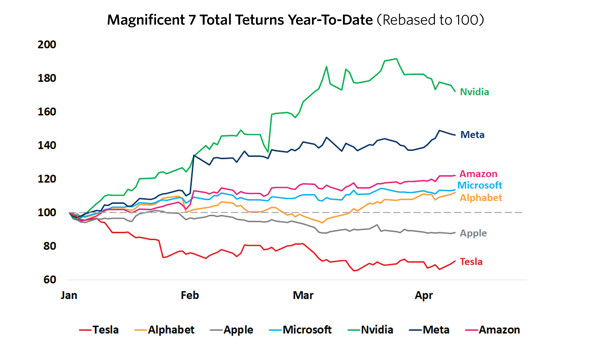
This chart shows the year-to-date performance of each stock within the exclusive Magnificent 7.
Chat of the Week - 4 April
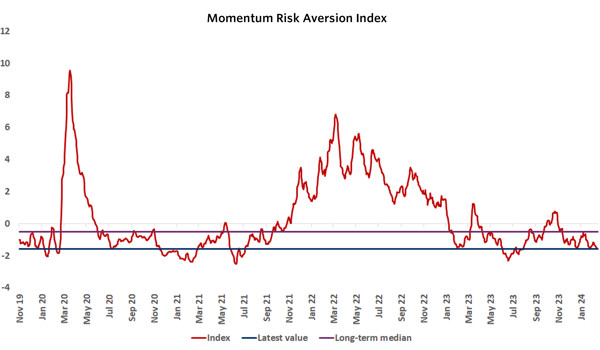
This chart shows Momentum Global Investment Management (MGIM) Risk Aversion Index over the last five years.
Chat of the Week - 28 March
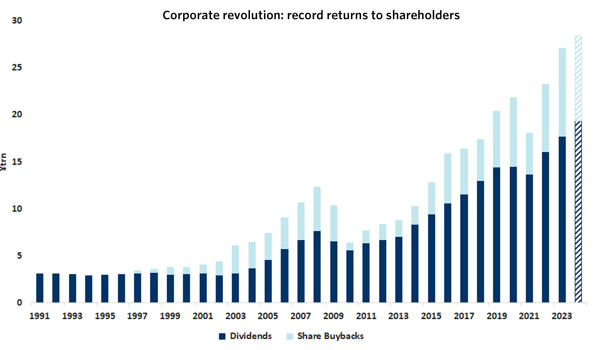
This chart shows a significant uplift trend in corporate returns to shareholders within Japan.
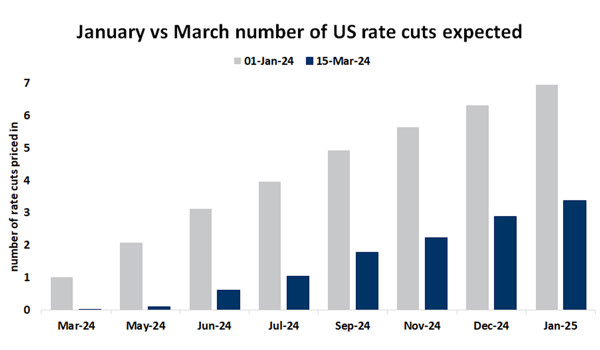
Chat of the Week - 21 March
This chart shows a comparison between the number of interest rate cuts expected by the US market (based on Federal Funds futures contracts) this month relative to the beginning of this year.
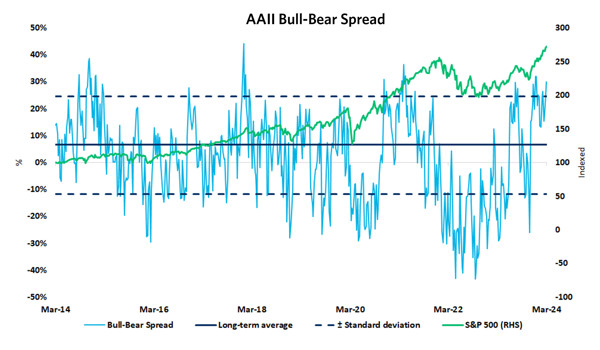
Chat of the Week - 14 March
The chart shows the American Association of Individual Investors (AAII) bull-bear spread and its relationship with the S&P 500 over the last decade.
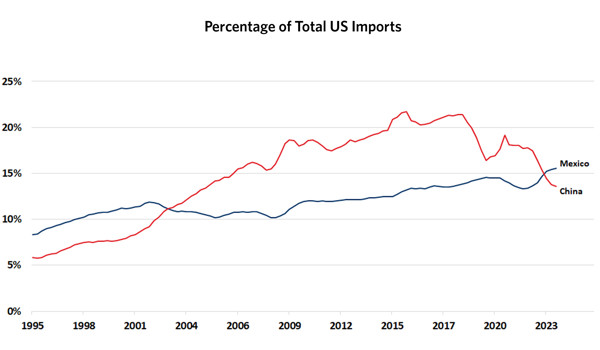
Chat of the Week - 7 March
This chart shows the percentage of total imports to the US coming from China and Mexico. For two decades China has been the number one exporter of goods into the US, however no longer.
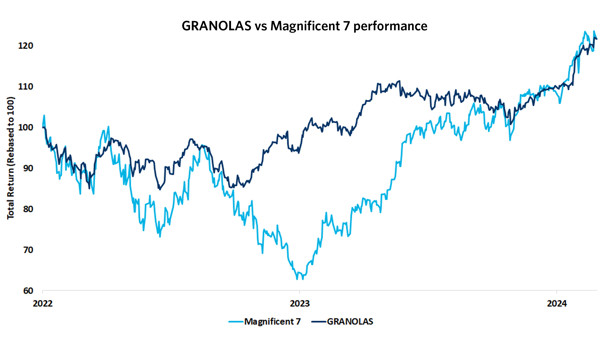
Chat of the Week - 29 February
This chart shows the performance of two groups: the GRANOLAS, comprising 11 European large-cap stocks, and the Magnificent 7, the exclusive group of US mega-cap tech stocks.
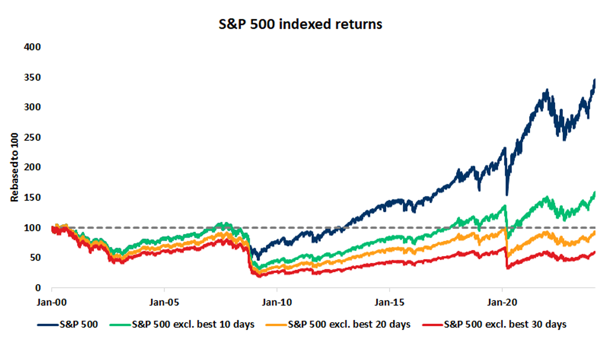
Chat of the Week - 22 February
This chart shows the indexed S&P 500 returns since 2000 alongside returns if one were to exclude the best performing 10, 20 and 30 days in this period.
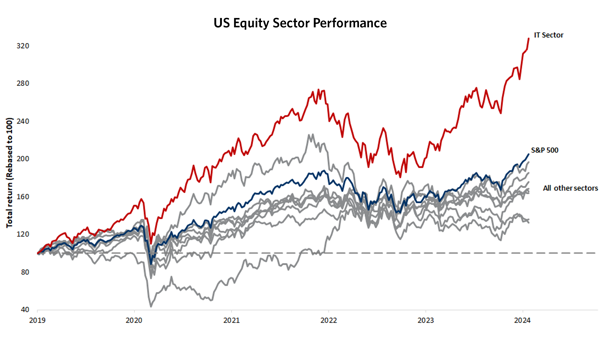
Chat of the Week - 15 February
This chart shows the performance of US equity sectors (Information Technology, Energy, Real Estate, Financials, Industrials, Health Care, Consumer Discretionary, Consumer Staples, Utilities) over the last five years compared to the overall index.
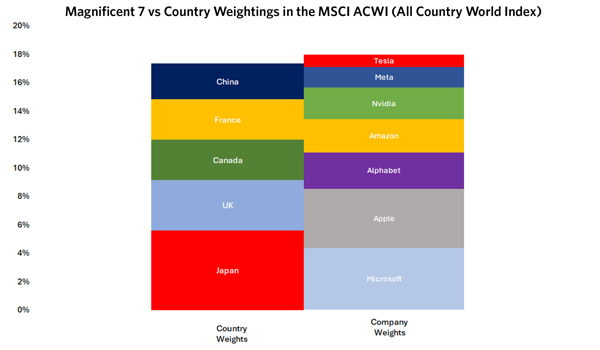
Chat of the Week - 8 February
This chart shows the market capitalisation weightings of Japan, UK, France, Canada, and China in the MSCI All Country World Index (ACWI) compared to the Magnificent 7's weighting. It highlights the sheer scale of this select group of stocks, which match up with the market values of entire countries.
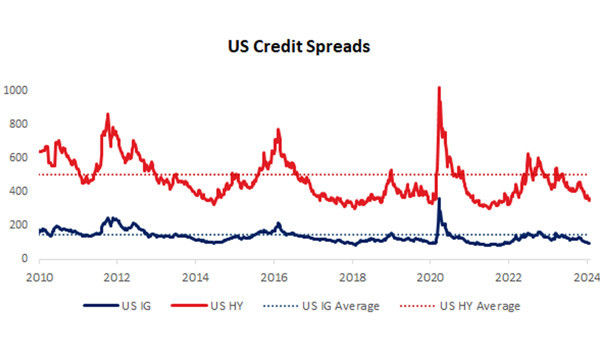
Chat of the Week - 1 February
This chart shows the spreads on US corporate debt since 2010. Spreads are the difference between the yields on a fixed income security and the yields on duration equivalent US treasuries.
Sources: 1 Bloomberg US Aggregate Bonds Total Return Unhedged Index. 2 Bloomberg US Corporate High Yield Total Return Unhedged Index.
Chat of the Week - 18 January
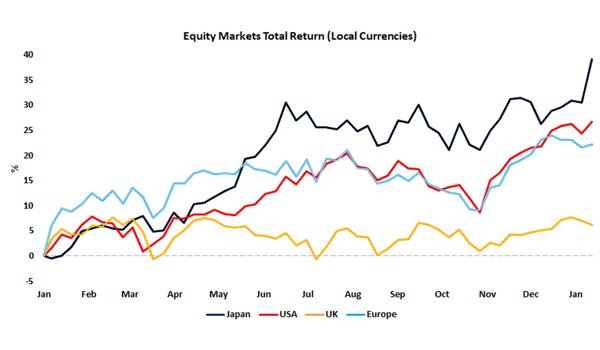
This chart shows the percentage total return of various major regional equity markets since the beginning of 2023, in local currency terms.
Source: Momentum Global Investment Management, Bloomberg Finance L.P. Data to 15th January 2024.
Chat of the Week - 11 January
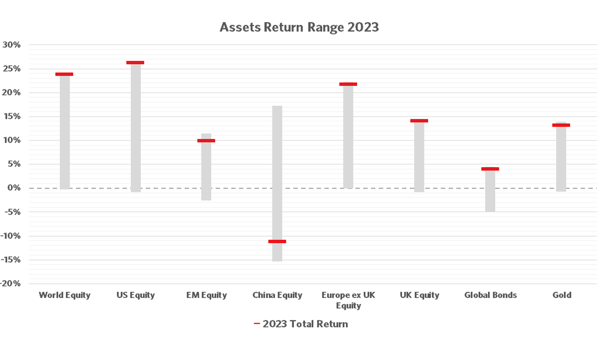
This chart shows the percentage total return (USD) of various assets in 2023 and their range of returns throughout the year.
Source: Momentum Global Investment Management, Bloomberg L.P. Data to 10 January 2024.
Chat of the Week - 14 December
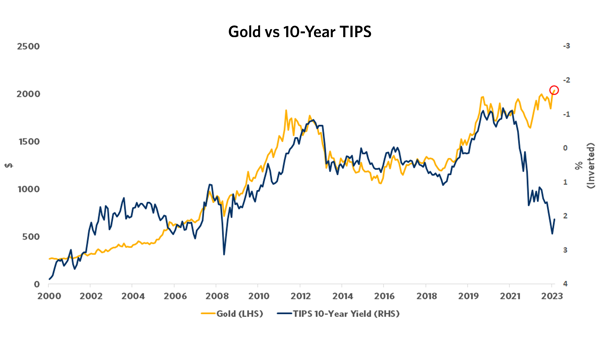
This chart shows the inverse of the yield on a 10-year Treasury Inflation Protected Security (TIPS)1 against the US Dollar denominated price of gold per troy ounce since 2000.
Source: Momentum Global Investment Management, Bloomberg L.P. Data to 12 December 2023.
Chat of the Week - 7 December
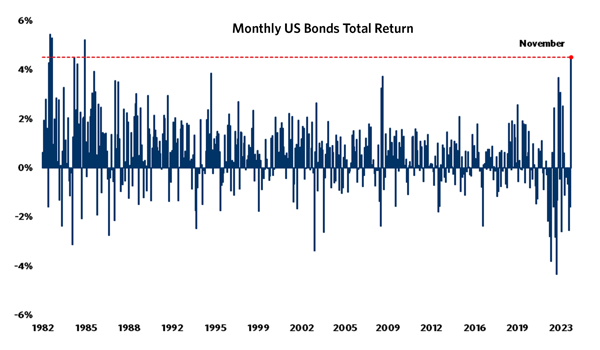
This chart shows the monthly returns of the Bloomberg US Aggregate bond index, a broad measure of total returns on US investment grade fixed income, over the past 30-years.
Source: Momentum Global Investment Management, Bloomberg L.P. Data to 5 December 2023.
Chat of the Week - 30 November
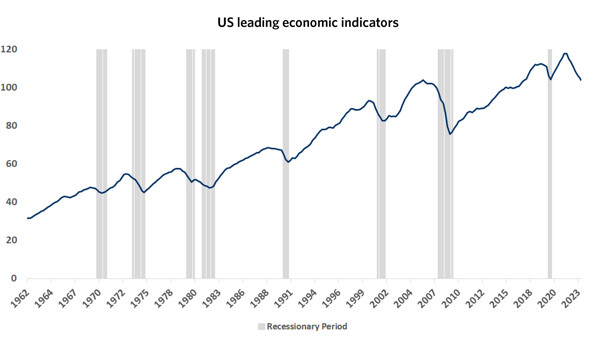
This chart shows the Conference Board’s index of US Leading Economic Indicators (LEIs) since 1962. The index is a composite measure comprising various economic indicators, ranging from jobless claims and building permits, to equity prices and yield spreads.
Source: Momentum Global Investment Management, Bloomberg L.P. Data to 28 November 2023.
Chat of the Week - 23 November
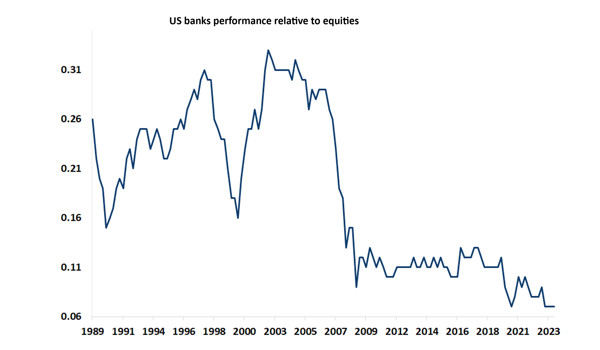
This chart shows the price of the US Banks Index relative to the price of the major US equity index, highlighting how US bank share prices are currently trading at an all-time low relative to the major US equity index, since the bank specific index began trading in 1989.
Source: Momentum Global Investment Management, Bloomberg L.P. Data to 22 November 2023.
Chat of the Week - 16 November
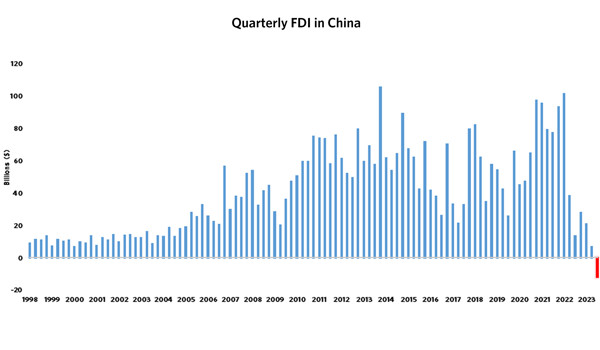
This chart shows the quarterly inflows of Foreign Direct Investment (FDI) into China since 1998. FDI is a component of a country’s Balance of Payments, representing investments made by foreign entities that involve a lasting interest and a level of control in the host country.
Source: Momentum Global Investment Management, Bloomberg L.P. Data to 15 November 2023.
Chat of the Week - 9 November
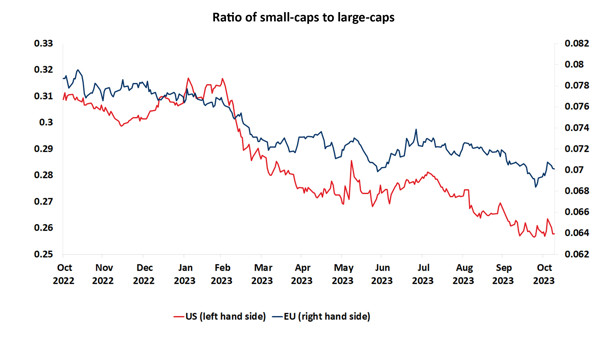
This chart shows the ratio between small-cap and large-cap indices prices in both the US (red line) and the EU (blue line) over the past year.
Source: Momentum Global Investment Management, Bloomberg L.P. Data to 8 November 2023.
Chat of the Week - 2 November
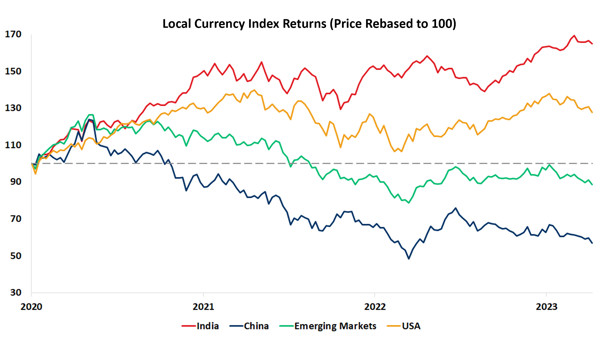
This chart shows the cumulative returns over the past three years of main India, China, Emerging Markets and US equity indices.
Source: Momentum Global Investment Management, Bloomberg L.P. Data to 25 October 2023.
Chat of the Week - 26 Oct
This chart shows the cumulative returns over the past three years of main India, China, Emerging Markets and US equity indices. The trends reveal how, amidst a challenging macro environment with economies recovering from the pandemic and withstanding high interest rates, India has performed best.
Source: Momentum Global Investment Management, Bloomberg L.P. Data to 25 October 2023.
Chat of the Week - 12 Oct
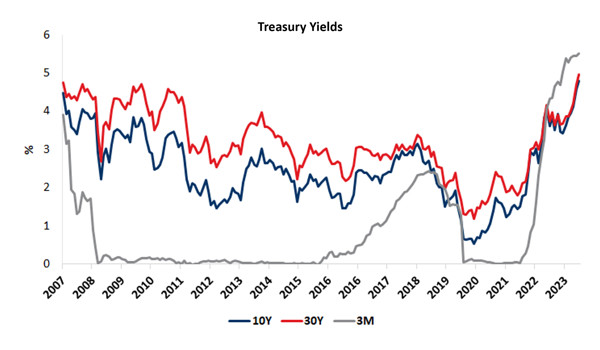
This chart shows the yields on treasuries reaching their highest levels since the Global Financial Crisis, fuelled by dramatic sell offs in the past couple weeks.
Source: Momentum Global Investment Management, Bloomberg L.P. Data to 9 October 2023.
Chat of the week - 5 Oct
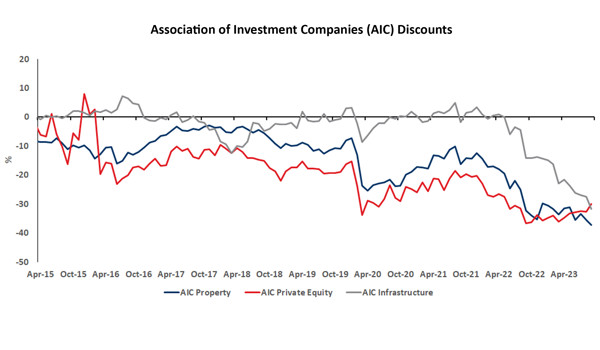
This chart shows the discounts of specialist or alternative asset (Association of Investment Companies property, private equity, and infrastructure) investment trusts’ share price to their Net Asset Value (NAV) since 2015.
Source: Momentum Global Investment Management, Morningstar. Data to 29 September 2023.
Chat of the Week - 28 Sep
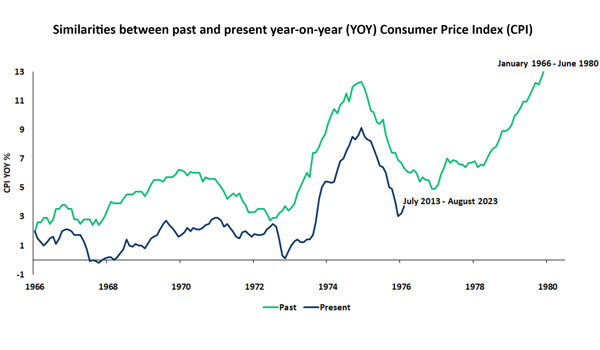
This chart shows a comparison between the trends in year-on-year Consumer Price Index (CPI) from 1966-1980 and 2013-2023, highlighting the striking similarity in the two periods.
Source: Momentum Global Investment Management, Bloomberg Finance L.P. Data to 31 August 2023.
Chat of the Week - 21 Sep
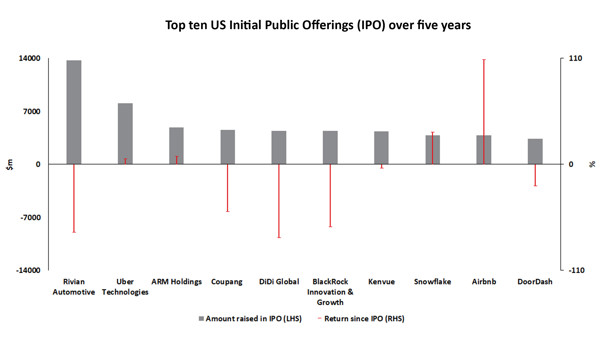
This chart shows the amount raised in the top ten Initial Public Offerings (IPOs) in the US over the past five years and the share price performance since the date of their listing.
Source: Momentum Global Investment Management, Bloomberg Finance L.P. Data to 19 September 2023.
Chat of the Week - 19 Sep
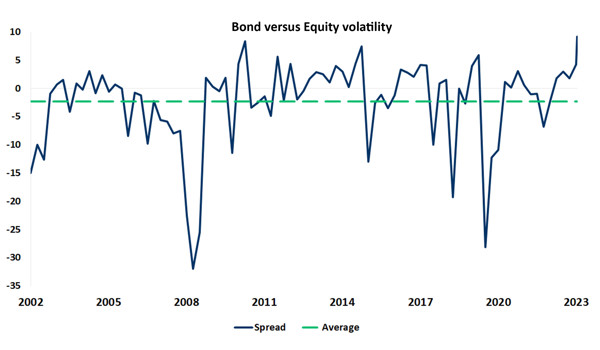
This chart shows the difference in 30-day volatility between the iShares 20+ Year Treasury Bond ETF (Exchange Traded Fund) and the SPDR S&P 500 Trust ETF. ETFs are funds traded on stock exchanges and typically hold a range of holdings in a specific asset class with the aim of tracking their overall price movements.
Source: Momentum Global Investment Management, Bloomberg L.P. Data to 17 October 2023.
Chat of the Week - 14 Sep
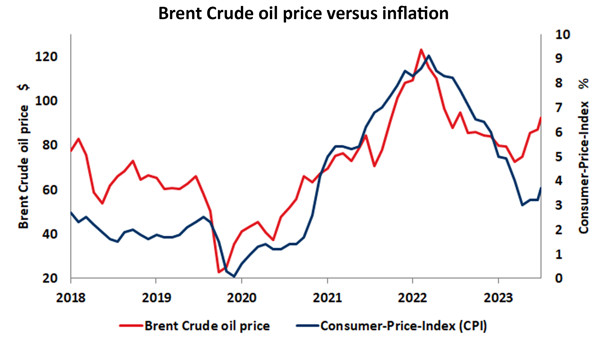
This chart compares the trends in the US Consumer Price Index (CPI) and Brent Crude oil’s price per barrel over the past five years.
Source: Momentum Global Investment Management, Bloomberg Finance L.P. Data to 13 September 2023.
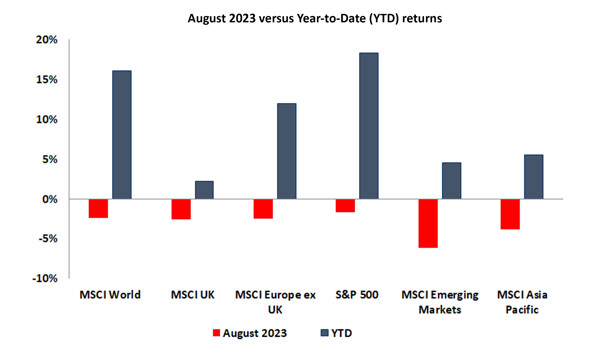
Chat of the Week - 7 Sep
This chart shows the stark contrast in global equity market returns experienced in August 2023 relative to the trends we have seen Year-to-Date (YTD).
Source: Momentum Global Investment Management, Bloomberg Finance L.P. Data to 31 August 2023.
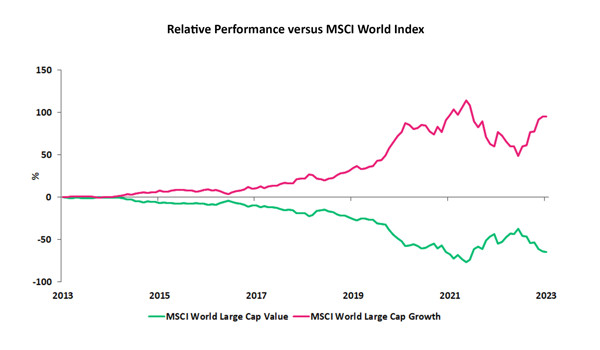
Chat of the Week - 31 Aug
The chart shows the 10-year cumulative performance of the MSCI World Large Cap Value and MSCI World Large Cap Growth indices, relative to the broader MSCI World index.
Source: Momentum Global Investment Management, Bloomberg Finance L.P. Data to 31 July 2023.
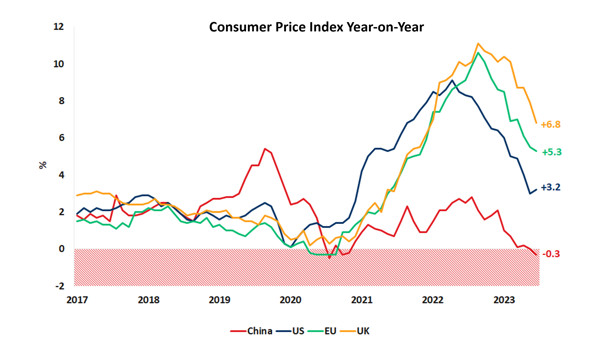
Chat of the Week - 24 Aug
This chart shows the year-on-year change in the Consumer Price Index (CPI) in the US, EU, UK and China since 2017.
Source: Momentum Global Investment Management, Bloomberg Finance L.P. Data to 31 July 2023.
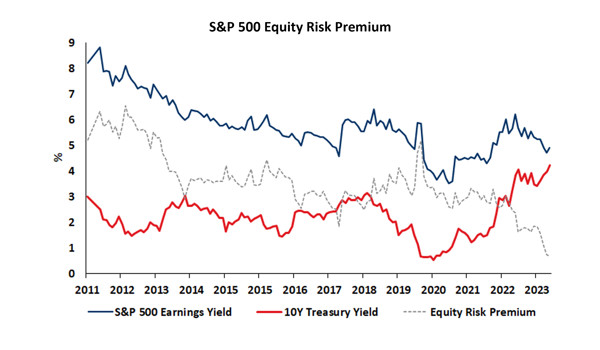
Chat of the Week - 17 Aug
This chart shows the S&P 500 earnings yield compared to the yield on 10-year US Treasuries since 2010 as a way of measuring the Equity Risk Premium (ERP) over time.
Source: Momentum Global Investment Management, Bloomberg Finance L.P. Data to 15 August 2023.
Chat of the Week - 10 Aug
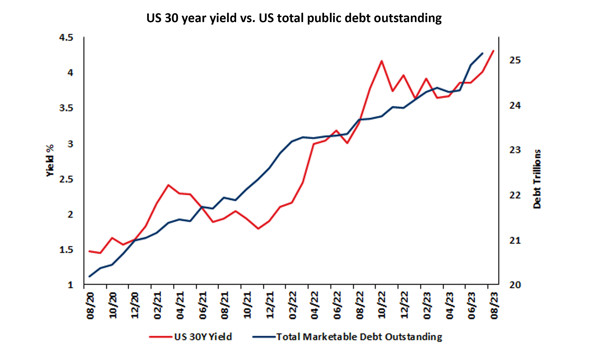
This chart illustrates the trends in US 30-year treasury yields over the last three years compared with the total outstanding US public marketable debt, highlighting how the rise in yields aligns with an increase in public borrowing.
Source: Momentum Global Investment Management, Bloomberg Finance L.P. Data to 31 August 2023.
Chat of the Week - 3 Aug
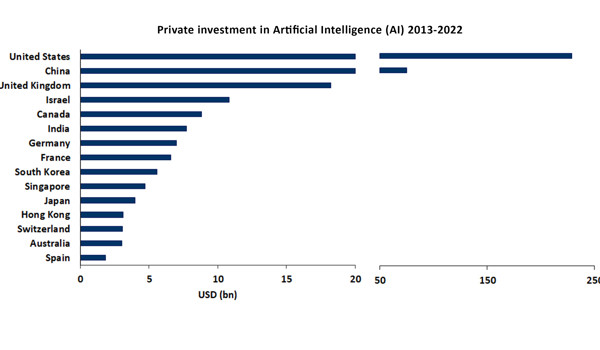
This chart shows the total aggregated private investment in Artificial Intelligence (AI) from 2013 to 2022 by country.
Source: Momentum Global Investment Management, Artificial Intelligence Index Report 2023.
Chat of the Week - 27 Jul
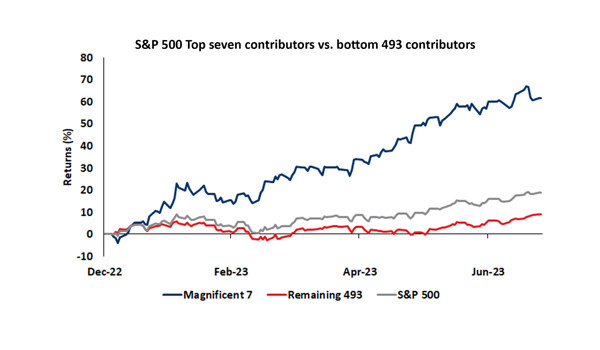
This chart shows the market capitalisation (market-cap) weighted performance of the largest seven contributors to the S&P 500 Index’s overall performance compared to the market-cap weighted performance of the remaining 493 companies.
Source: Momentum Global Investment Management, FactSet. Data to 25 July 2023.
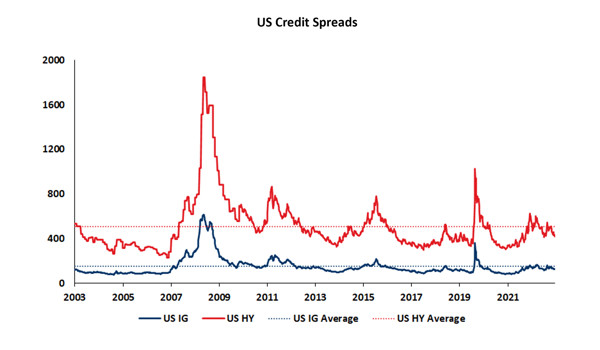
Chart of the Week - 20 Jul
This chart shows the spreads on US corporate debt.
Source: Momentum Global Investment Management, International Monetary Fund. Data to 14 July 2023.
Chat of the week - 13 Jul
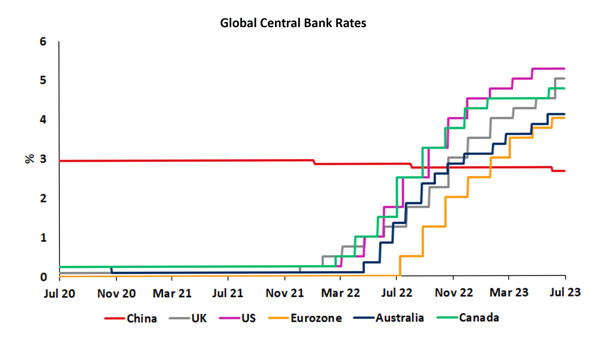
This chart shows the target interest rates of several major central banks.
Source: Momentum Global Investment Management, Bloomberg Finance L.P. Data to 12 July 2023.
Chat of the Week - 6 Jul
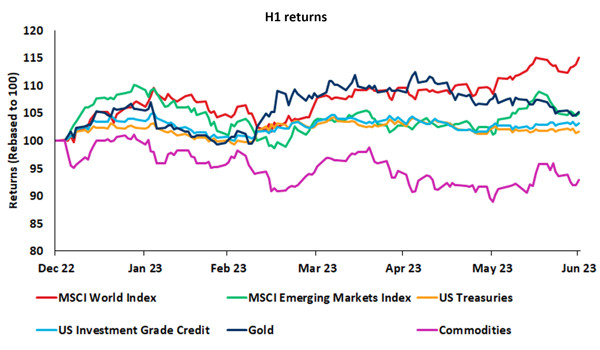
This chart shows the performance of a variety of major asset classes in the first half of 2023.
Source: Momentum Global Investment Management, Bloomberg Finance L.P., data to 30 June 2023.
Chat of the Week - 29 Jun
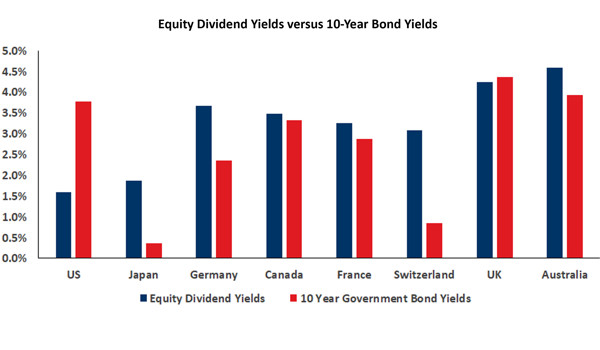
The chart shows the difference in yield that investors receive on equities compared to the yield received on 10-year government bonds.
Source: Momentum Global Investment Management, Bloomberg Finance L.P. Data to 27 June 2023.
Chat of the Week - 22 Jun
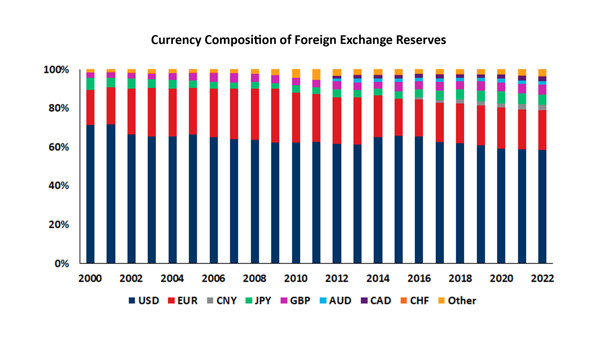
This chart shows the currency composition of the foreign exchange reserves of global central banks.
Source: Momentum Global Investment Management, International Monetary Fund. Data to 31 December 2022.
Chat of the Week - 15 Jun
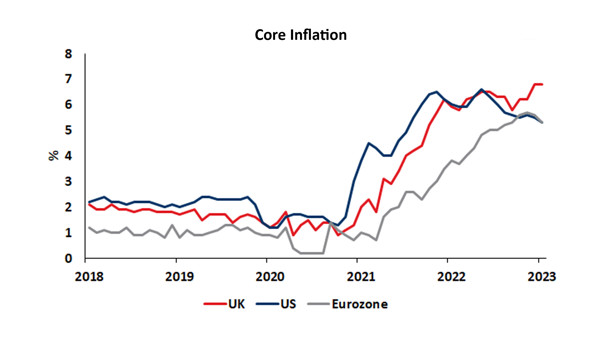
This chart shows the year-on-year core inflation for the UK, US, and Eurozone.
Source: Momentum Global Investment Management, Bloomberg Finance L.P., data to 14 June 2023.
Chat of the Week - 8 Jun
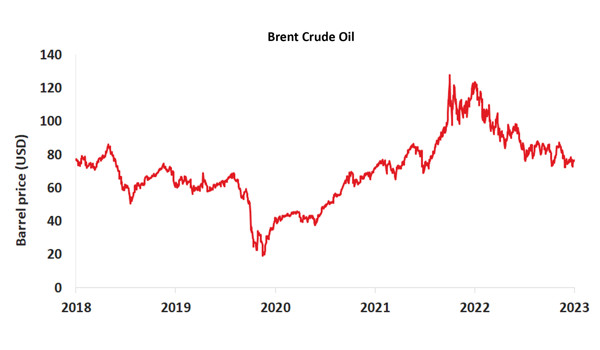
This chart shows the price of a barrel of Brent Crude Oil over the past five years, which is one of the major benchmarks used to set global oil prices.
Source: Momentum Global Investment Management, Bloomberg Finance L.P., data to 7 June 2023.
Chat of the Week - 1 Jun
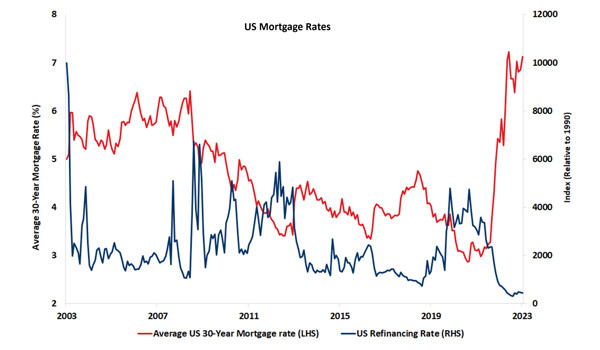
This chart shows the current US average 30-year (Y) fixed mortgage rate versus the number of mortgage refinancings.
Source: Momentum Global Investment Management, Bloomberg Finance L.P., data to 31 May 2023.
Chat of the Week - 25 May
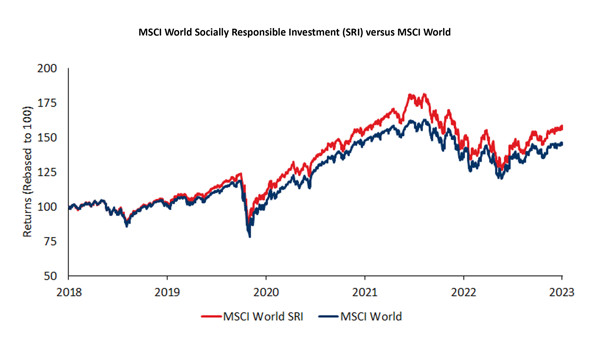
This chart shows the five-year return of the MSCI World Socially Responsible Investment (SRI) Index against the MSCI World Index.
Source: Momentum Global Investment Management, Bloomberg Finance L.P., data to 24 May 2023.
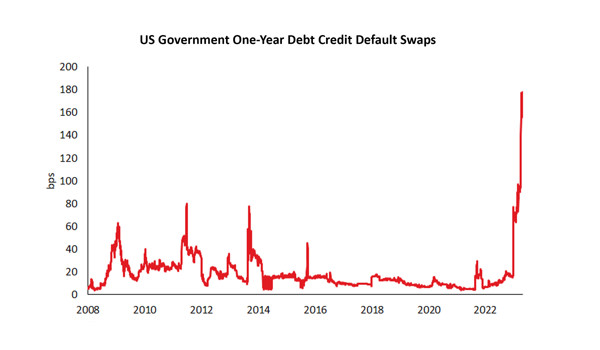
Chat of the Week - 18 May
This chart shows the premium of one-year year US government debt credit default swaps (CDS).
Source: Momentum Global Investment Management, Bloomberg Finance L.P., data to 15 May 2023.
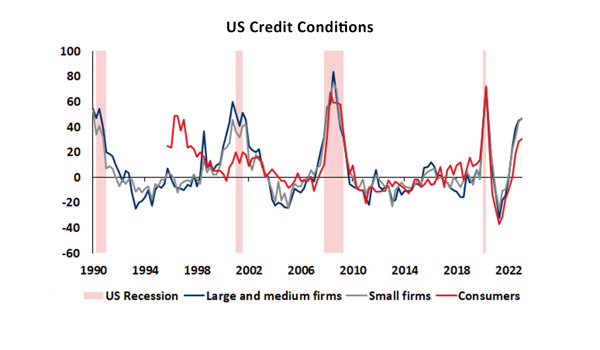
Chat of the Week - 11 May
This chart shows the results of the latest quarterly Federal Reserve Senior Loan Officer Opinion Survey (SLOOS) combined with recessionary periods in the US.
Source: Momentum Global Investment Management, Bloomberg Finance L.P., data to 30 April 2023.
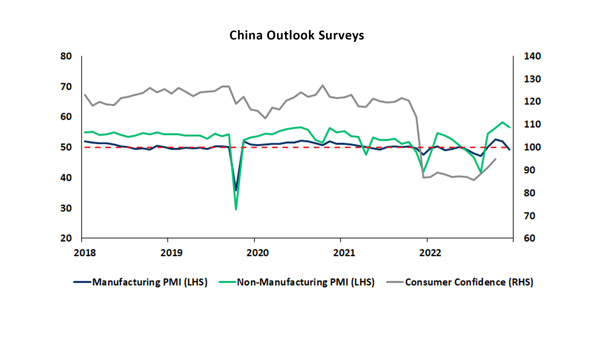
Chat of the Week - 4 May
This chart shows the results of China’s Purchasing Managers Index (PMI) and Consumer Confidence surveys, which indicate the prevailing direction of economic trends in the country.
Source: Momentum Global Investment Management, Bloomberg Finance L.P., data to 30 April 2023.
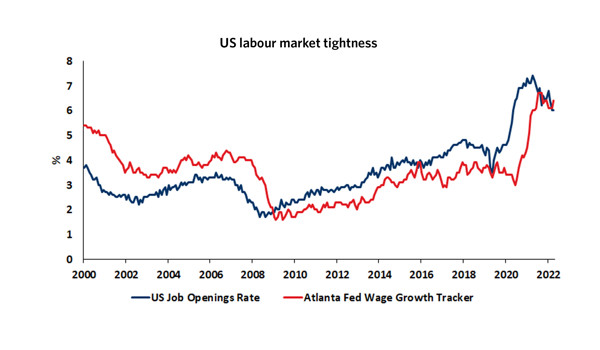
Chat of the Week - 27 Apr
This chart shows the US Job Openings Rate and the Atlanta Fed Wage Growth Tracker. These two indicators can be used to gain an understanding of the tightness of the US labour market.
Source: Momentum Global Investment Management, Bloomberg Finance L.P. Data to 31 March 2023.
Chat of the Week - 20 Apr
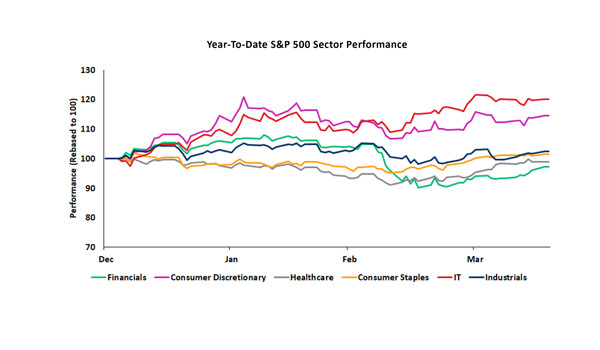
This chart shows the year-to-date (YTD) performance of the S&P 500 stocks by sector. Defined using the Global Industry Classification Standard methodology, each of the S&P 500 constituents are assigned to a sector.
Source: Momentum Global Investment Management, Bloomberg Finance L.P. Data to 18 April 2023.
Chat of the Week - 13 Apr
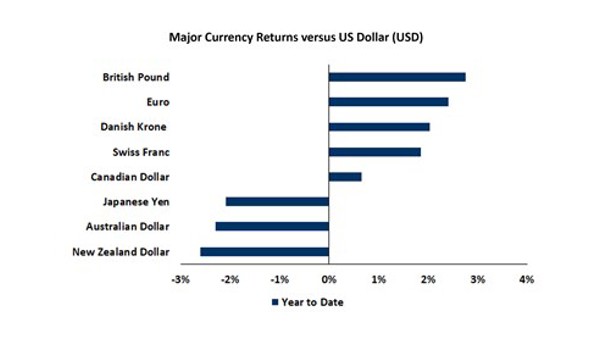
This chart shows the year-to-date returns of several developed market currencies against the US dollar (USD).
Source: Momentum Global Investment Management, Bloomberg Finance L.P. Data to 12 April 2023.
Chat of the Week - 6 Apr
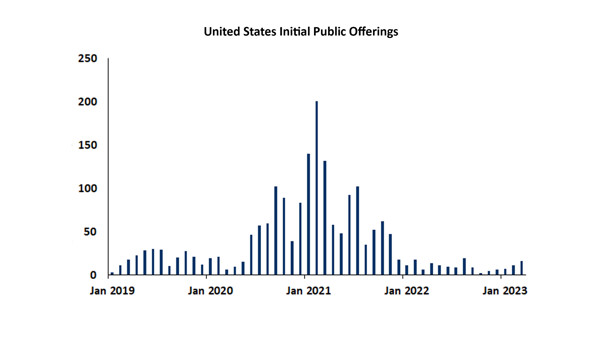
This chart shows the number of initial public offerings (IPOs) that have occurred each month in the United States (US) on either the New York Stock Exchange or the NASDAQ.
Source: Momentum Global Investment Management, FactSet. Data to 31 March 2023.
Chat of the Week - 30 Mar
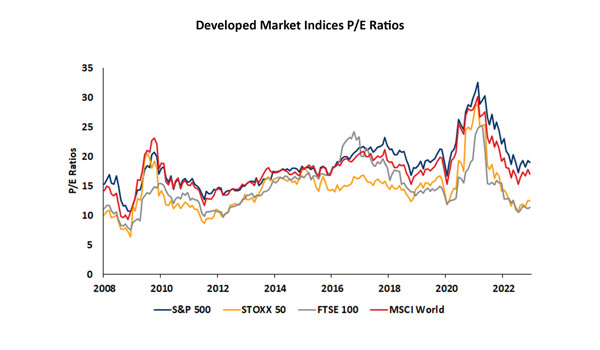
This chart shows the market weighted average price to earnings (P/E) ratio of major equity indices in the US, UK, and Europe, as well as the Morgan Stanley Capital International (MSCI) World index, which is made up of holdings across all developed market equity markets.
Source: Momentum Global Investment Management, Bloomberg Finance L.P. Data to 29 March 2023.
Chat of the Week - 23 Mar
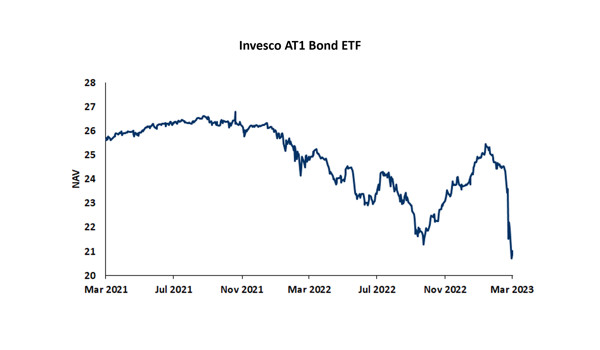
This chart shows the performance of the Invesco Additional Tier-One (AT1) Bond Exchange Traded Fund (ETF).
Source: Momentum Global Investment Management, Bloomberg Finance L.P. Data to 21 March 2023.
Chat of the Week - 16 Mar
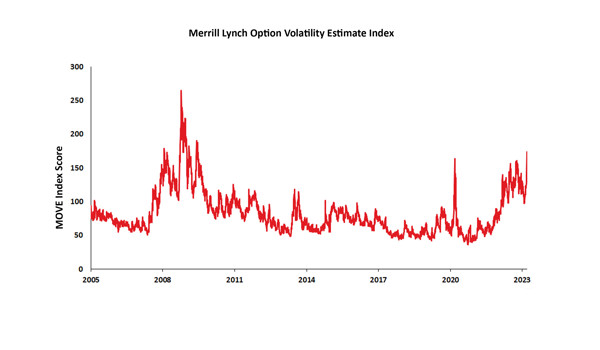
This chart shows the Merrill Lynch Option Volatility Estimate (MOVE) index since 2005. The MOVE index is a measure of the volatility in the US treasury market.
Source: Momentum Global Investment Management, Bloomberg Finance L.P. Data to 14 March 2023.
Chat of the Week- 9 Mar
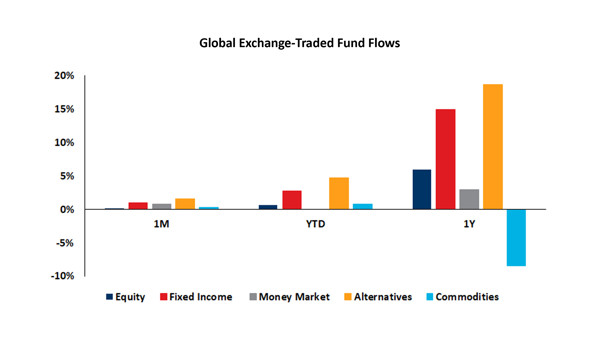
This chart shows Global Exchange-Traded Fund (ETF) flows across a variety of asset classes and time periods. These flows are given as a proportion of current holdings and indicate which asset classes are most popular with investors.
Source: Momentum Global Investment Management, Bloomberg Finance L.P. Data to 7 March 2023.
Chat of the Week - 2 Mar
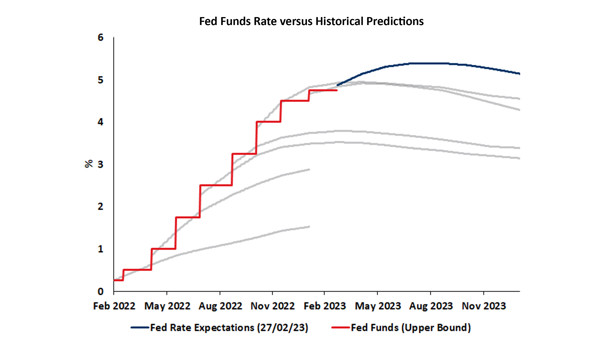
This chart shows the upper bound of the Federal Reserve (Fed) Funds rate over the past year, as well as what the market’s forward predictions for the rate were at various stages throughout the year based on futures markets.
Source: Momentum Global Investment Management, Bloomberg Finance L.P. Data to 27 February 2023.
Chat of the Week - 23 Feb
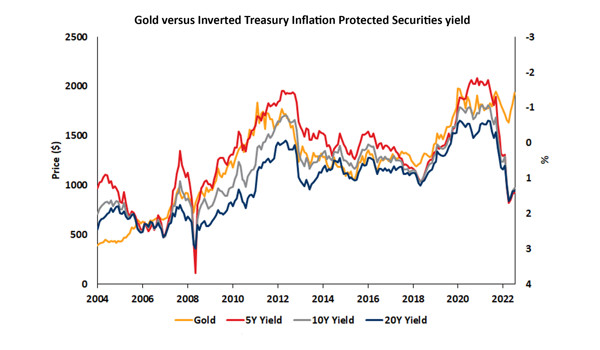
This chart shows the inverse of the yields of five, ten, and twenty-year Treasury Inflation Protected Securities (TIPS) against the US Dollar price of gold since 2004.
Source: Momentum Global Investment Management, Bloomberg Finance L.P. Data to 31 January 2023.
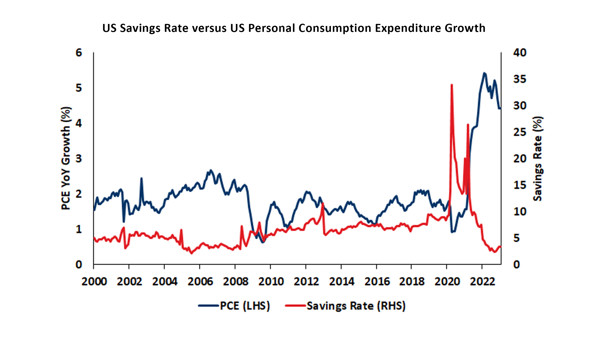
Chart of the Week - 16 Feb
This chart shows the year-on-year change in the level of Personal Consumption Expenditure (PCE) in the US and the savings rate of US individuals. US PCE is used to reflect changes in the behaviour of consumers.
Source: Momentum Global Investment Management, Bloomberg. Data to 31 January 2023.
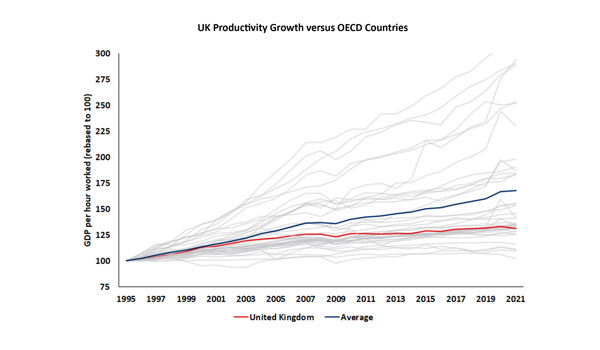
Chart of the Week - 9 Feb
This chart shows the productivity growth of all Organisation for Economic Co-operation and Development (OECD) economies since 1995.
Source: Momentum Global Investment Management, Organisation for Economic Co-operation and Development (OECD), data to 2021.
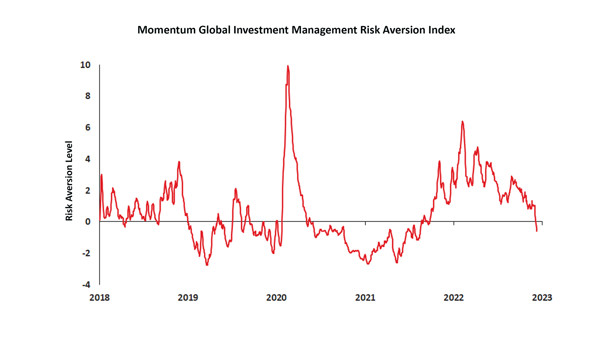
Chart of the Week - 2 Feb
This chart shows the Momentum Global Investment Management Risk Aversion Index over the past five years.
Source: Momentum Global Investment Management, Bloomberg Finance L.P. Data to 11 January 2023.
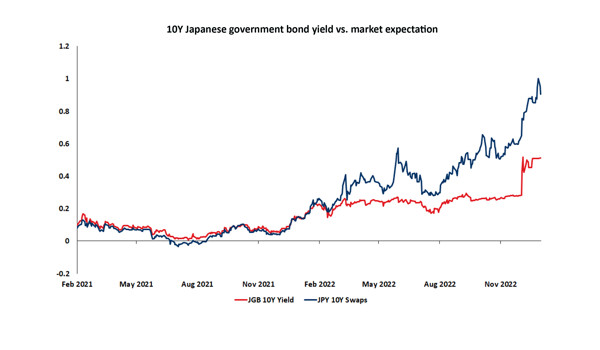
Chart of the Week - 19 Jan
This chart shows the yield of Japanese 10-year government bonds versus the yield on 10-year Japanese Yen swaps over the past two years.
Source: Momentum Global Investment Management, Bloomberg Finance L.P. Data to 17 January 2023.
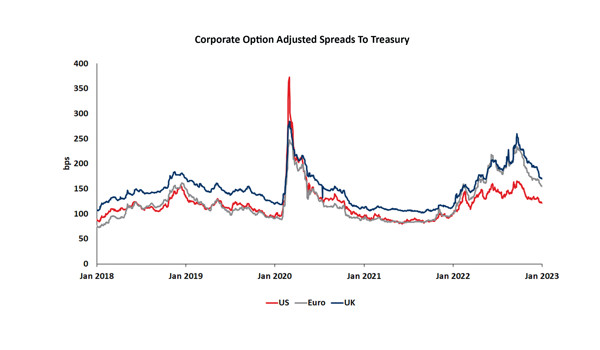
Chart of the Week - 26 Jan
This chart shows the option adjusted spread between corporate bonds and US treasuries in market-weighted regional universes.
Source: Momentum Global Investment Management, Bloomberg Finance L.P. Data to 24 January 2023.
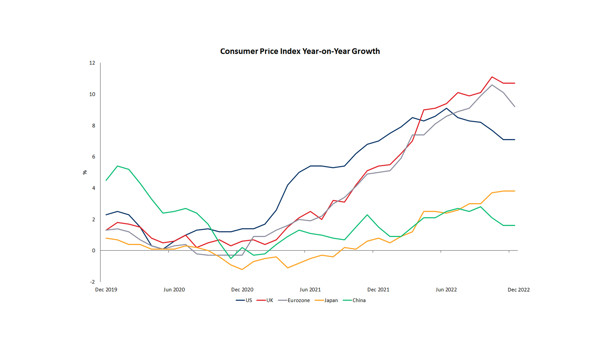
Chart of the Week - 12 Jan
This chart shows the levels of inflation across five major global economies as measured by year-on-year Consumer Price Index (CPI) growth.
Source: Momentum Global Investment Management, Bloomberg Finance L.P. data as at 31 December 2022.