Chart of the Week: 21 October 2024

This shows how the UK investment trust market (excluding 3i) has moved to varying degrees of discount over the last 20 years.

Chart of the Week - 14 October
This chart shows the cumulative performance of defensive equities, here approximated using the MSCI World Minimum Volatility Index, and of the market-cap weighted global equity index, since the end of 2021.

Chart of the Week - 7 October
The chart above shows the recent performance of Chinese equities, proxied here by the country’s blue-chip CSI 300 index of Shanghai and Shenzen- listed companies, following the announcement of monetary stimulus from the Chinese authorities.

Chart of the Week - 26 September
This chart shows the widening valuation gap between US small cap stocks (Russell 2000) and large cap stocks (S&P 500), based on their price-to-sales ratios (P/S).

Chart of the Week - 19 September
This chart shows the cumulative net inflows for global ETFs across all asset classes for the past four calendar years.

Chat of the Week - 12 September
This chart shows the average monthly returns of the S&P 500 since 1928.

Chat of the Week - 5 September
This chart shows the market capitalisation of Berkshire Hathaway for the past year up to 30 August 2024.

Chat of the Week - 29 August
This chart shows the price of the S&P 500 relative to that of gold from August 1971.

Chat of the Week - 22 August
This chart shows the year’s progression of expected cuts by the Fed of the Federal fund rate at Federal Open Market Committee (FOMC) meetings scheduled from September to next year March, measured in basis point reductions of the rate.

Chat of the Week - 8 August
This chart shows the Sahm Rule Recession Indicator (Sahm Rule) from 1960 to July 2024.

Chat of the Week - 1 August
This chart shows the performance of the S&P Oil & Gas Exploration and Production Select Industry Index and the iShares Global Clean Energy ETF during the Trump and Biden administrations.

Chat of the Week - 25 July
This chart shows the top 20 three-month periods of relative outperformance of the S&P 500 market capitalisation weighted index compared to the S&P 500 equally weighted index, along with the subsequent 1-year and 3-year relative returns.

Chat of the Week - 18 July
This chart shows the Citigroup US Economic Surprise Index from the start of 2023.

Chat of the Week - 11 July
This chart shows the spread year-to-date between French and German 10-year government bonds, highlighting the key dates during the French parliamentary election.

Chat of the Week - 4 July
The chart shows the number of times the S&P 500 index has reached an all-time high each calendar year since 1957.

Chat of the Week - 27 June
This chart shows the market capitalisation of the current three largest companies in the world – Apple Microsoft and Nvidia – over the past few years; highlighting Nvidia’s meteoric rise to become the world’s most valuable company

Chat of the Week - 20 June
This chart shows the market capitalisation of the current three largest companies in the world – Apple Microsoft and Nvidia – over the past few years; highlighting Nvidia’s meteoric rise to become the world’s most valuable company

Chat of the Week - 13 June
This chart shows the interest rates in the EU, UK and US over the past four years.

Chart of the Week - 6 June
The chart shows the total assets held in money market funds from 2007 to end May 2024, highlighting a substantial expansion over the period.

Chart of the Week - 30 May
This chart shows the percentage of total US credit card loans outstanding for 90 days or more in arrears, otherwise known as, serious delinquency.

Chat of the Week - 23 May
This chart shows the Congressional Budget Office’s (CBO) projections for total outstanding US debt and interest expenses as a percentage of GDP over the next 30 years.

Chat of the Week - 16 May
This chart shows the Congressional Budget Office’s (CBO) projections for total outstanding US debt and interest expenses as a percentage of GDP over the next 30 years.

Chat of the week - 9 May
This week’s chart looks at how the Federal Reserve’s conclusion of a hiking cycle impacts US Treasuries.
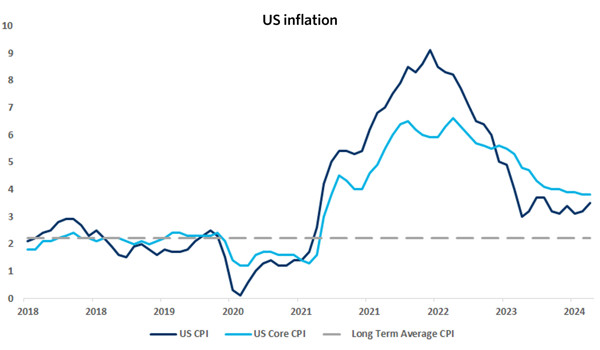
Chat of the Week - 25 April
This chart shows the US Headline and Core1 CPI (Consumer Price Index) measure over the past five years, highlighting how disinflationary progress has stalled in recent months.
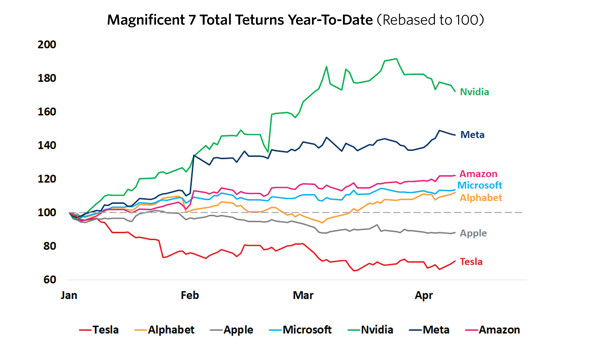
Chat of the Week - 11 April
This chart shows the year-to-date performance of each stock within the exclusive Magnificent 7.
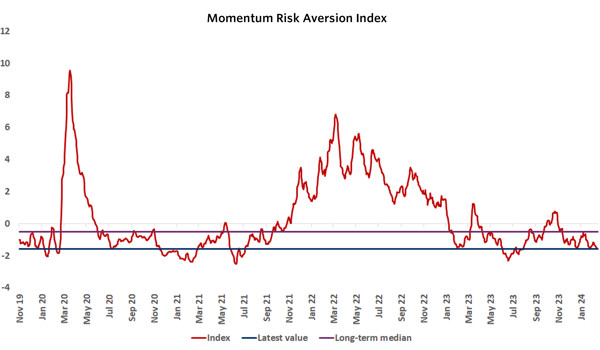
Chat of the Week - 4 April
This chart shows Momentum Global Investment Management (MGIM) Risk Aversion Index over the last five years.
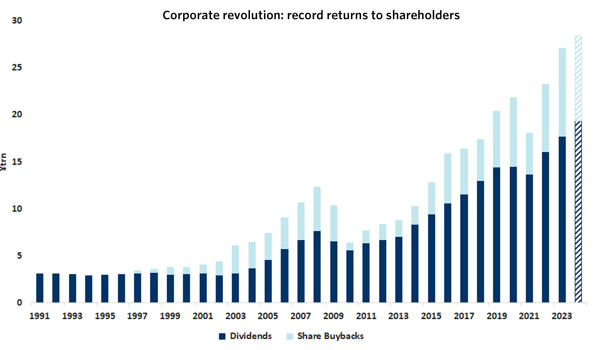
Chat of the Week - 28 March
This chart shows a significant uplift trend in corporate returns to shareholders within Japan.
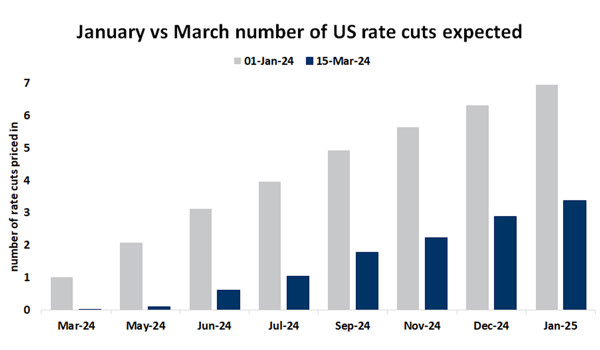
Chat of the Week - 21 March
This chart shows a comparison between the number of interest rate cuts expected by the US market (based on Federal Funds futures contracts) this month relative to the beginning of this year.
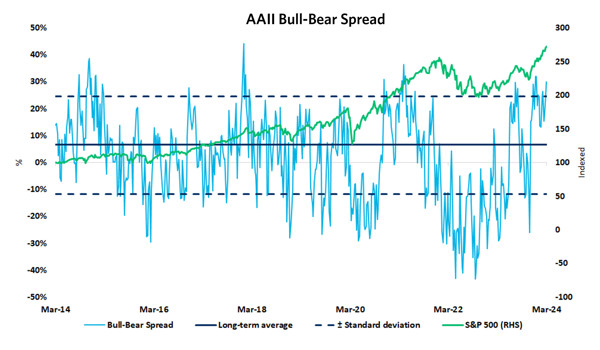
Chat of the Week - 14 March
The chart shows the American Association of Individual Investors (AAII) bull-bear spread and its relationship with the S&P 500 over the last decade.
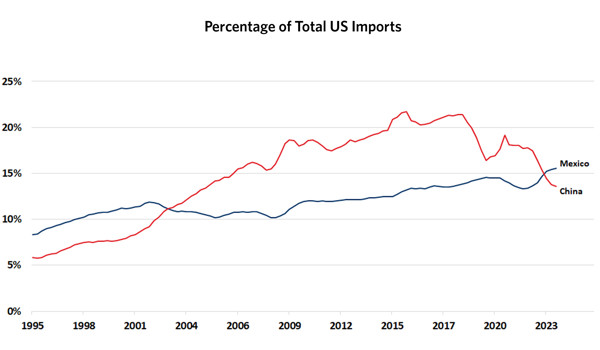
Chat of the Week - 7 March
This chart shows the percentage of total imports to the US coming from China and Mexico. For two decades China has been the number one exporter of goods into the US, however no longer.
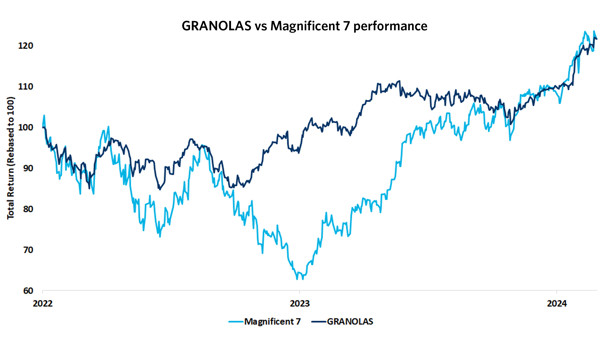
Chat of the Week - 29 February
This chart shows the performance of two groups: the GRANOLAS, comprising 11 European large-cap stocks, and the Magnificent 7, the exclusive group of US mega-cap tech stocks.
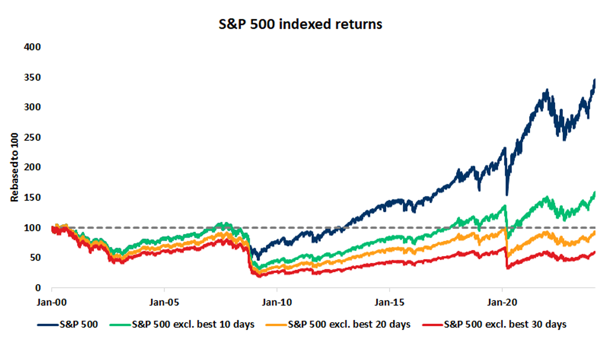
Chat of the Week - 22 February
This chart shows the indexed S&P 500 returns since 2000 alongside returns if one were to exclude the best performing 10, 20 and 30 days in this period.
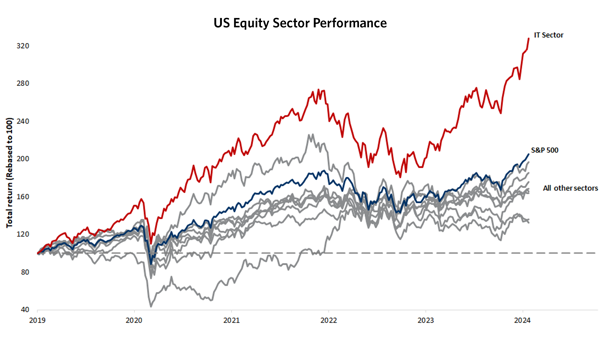
Chat of the Week - 15 February
This chart shows the performance of US equity sectors (Information Technology, Energy, Real Estate, Financials, Industrials, Health Care, Consumer Discretionary, Consumer Staples, Utilities) over the last five years compared to the overall index.
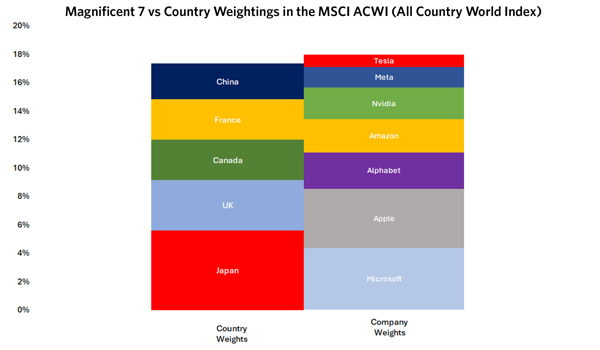
Chat of the Week - 8 February
This chart shows the market capitalisation weightings of Japan, UK, France, Canada, and China in the MSCI All Country World Index (ACWI) compared to the Magnificent 7's weighting. It highlights the sheer scale of this select group of stocks, which match up with the market values of entire countries.
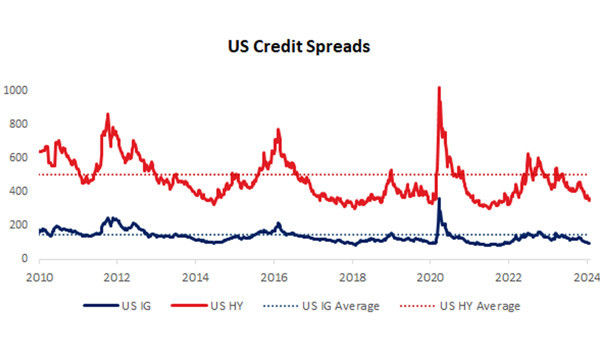
Chat of the Week - 1 February
This chart shows the spreads on US corporate debt since 2010. Spreads are the difference between the yields on a fixed income security and the yields on duration equivalent US treasuries.
Sources: 1 Bloomberg US Aggregate Bonds Total Return Unhedged Index. 2 Bloomberg US Corporate High Yield Total Return Unhedged Index.
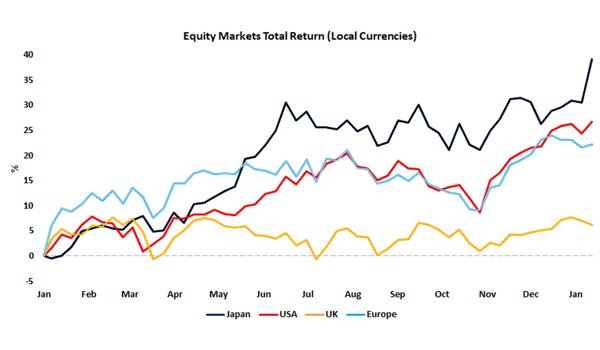
Chat of the Week - 18 January
This chart shows the percentage total return of various major regional equity markets since the beginning of 2023, in local currency terms.
Source: Momentum Global Investment Management, Bloomberg Finance L.P. Data to 15th January 2024.
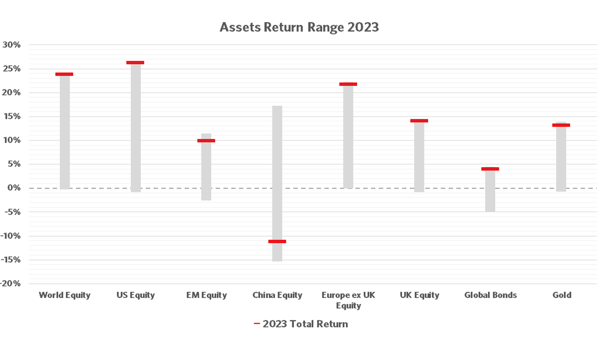
Chat of the Week - 11 January
This chart shows the percentage total return (USD) of various assets in 2023 and their range of returns throughout the year.
Source: Momentum Global Investment Management, Bloomberg L.P. Data to 10 January 2024.